PostgreSQL Shared Buffers and the Clock-Sweep Eviction Algorithm
Learn how PostgreSQL caches data in memory, manages buffer replacement, and why the clock-sweep algorithm is critical for database performance.
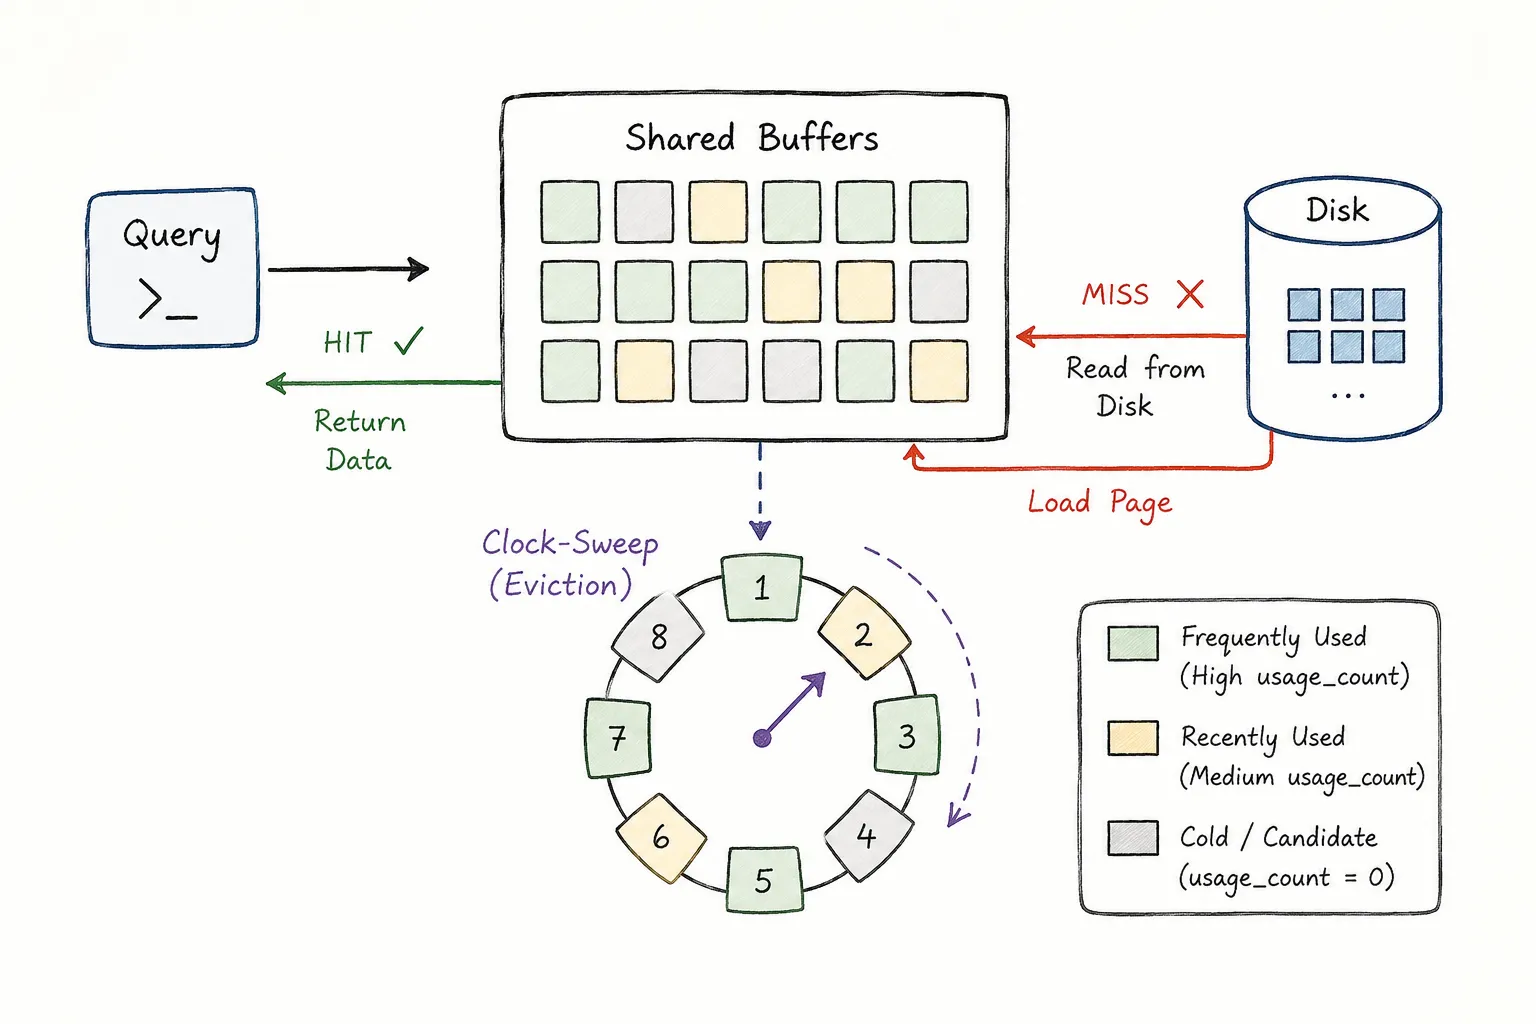
Most developers spend time optimizing queries, adding indexes, or tuning database settings. But one of the biggest reasons PostgreSQL feels fast is something we rarely think about: memory management. Before PostgreSQL touches the disk, it first checks whether the data is already available in memory. Understanding how this works can completely change how you think about database performance.
Why PostgreSQL Needs a Buffer Cache
Reading data from RAM is dramatically faster than reading data from disk. Even modern SSDs are several orders of magnitude slower than memory access. If PostgreSQL had to fetch data from disk for every query, applications would feel painfully slow.
To avoid this, PostgreSQL maintains an in-memory cache called Shared Buffers. This cache stores recently accessed database pages so future queries can reuse them without performing expensive disk I/O.
When a query arrives, PostgreSQL follows a simple process:
- Check whether the required page exists in memory.
- If found, return the page immediately.
- If not found, load the page from disk.
- Store the page in Shared Buffers for future access.
This strategy significantly reduces disk reads and improves overall throughput.
Understanding Shared Buffers
Shared Buffers is PostgreSQL’s primary buffer cache. Every PostgreSQL process can access it, which is why it is called “shared.”
Instead of caching rows, PostgreSQL caches pages. A page is the fundamental unit of storage in PostgreSQL and is typically 8 KB in size.
For example, consider the query:
SELECT * FROM users WHERE id = 100;Even if only a single row is needed, PostgreSQL loads the entire page containing that row. This approach is efficient because nearby rows are often accessed together.
Buffer Hits and Buffer Misses
Whenever PostgreSQL looks for a page, one of two things happens:
Buffer Hit
The page is already present in Shared Buffers.
Query
  ↓
Shared Buffers
  ↓
Page Found
  ↓
Return Data
Buffer Miss
The page is not present in memory.
Query
  ↓
Shared Buffers
  ↓
Page Not Found
  ↓
Read From Disk
  ↓
Store In Buffer
A high buffer hit ratio usually indicates a healthy and efficient workload.
The fastest disk read is the one you never have to perform.
What Happens When Shared Buffers Fills Up?
Memory is finite. Eventually Shared Buffers reaches capacity and PostgreSQL must decide which page should be removed to make room for new data.
Many systems use a traditional Least Recently Used (LRU) strategy. PostgreSQL takes a different approach.
Instead of pure LRU, PostgreSQL uses a more scalable mechanism known as the Clock-Sweep Algorithm.
The primary goal is simple:
- Keep frequently used pages in memory.
- Remove pages that are no longer useful.
- Minimize synchronization overhead under heavy concurrency.
The Clock-Sweep Algorithm
Imagine every buffer arranged in a circular structure. PostgreSQL maintains a moving pointer, often called the clock hand, that continuously sweeps through the buffer pool.
Each buffer tracks a small metric called usage_count.
Whenever a page is accessed:
Page Accessed
    ↓
usage_count++
Frequently accessed pages accumulate higher usage counts.
For example:
Page A = 5
Page B = 3
Page C = 1
A higher value means PostgreSQL has observed more recent activity on that page.
Giving Pages a Second Chance
When PostgreSQL needs space for a new page, the clock hand begins scanning buffers.
If a page has a positive usage_count, PostgreSQL does not immediately evict it.
Instead:
usage_count > 0
      ↓
usage_count--
      ↓
Skip Page
This effectively gives the page another chance to remain in memory.
For example:
Before Sweep

Page A = 3
Page B = 2
Page C = 1

After Sweep

Page A = 2
Page B = 1
Page C = 0
Only pages that remain unused over multiple sweeps gradually become candidates for eviction.
Selecting a Victim Page
Eventually the clock hand encounters a page whose usage_count reaches zero.
Page D = 0
      ↓
    Evict
      ↓
Load New Page
This page becomes the replacement candidate and PostgreSQL loads the new page into its slot.
The result is a lightweight approximation of LRU without maintaining expensive linked lists or constantly reshuffling memory structures.
Why PostgreSQL Doesn’t Use Pure LRU
At first glance, LRU sounds ideal. Remove the least recently used page and keep the most active pages in memory.
The problem appears when thousands of concurrent sessions access the database.
A traditional LRU implementation often requires:
- Frequent list updates.
- Additional locking.
- Increased contention between processes.
- More CPU overhead.
The Clock-Sweep algorithm avoids most of these costs while still preserving the important property of keeping hot pages in memory.
This design choice makes PostgreSQL scale much better under real-world workloads.
PostgreSQL chooses predictable scalability over perfect recency tracking.
Dirty Buffers and Disk Writes
Not every page in Shared Buffers is read-only.
Consider the following query:
UPDATE users
SET balance = balance + 100
WHERE id = 42;
The page is modified in memory first.
Once modified, PostgreSQL marks the page as a dirty buffer.
Disk Page
    ↓
Loaded Into Memory
    ↓
Modified
    ↓
Dirty Buffer
A dirty buffer means the in-memory version is newer than the copy stored on disk.
PostgreSQL does not immediately flush every change to disk. Instead, background processes handle this work efficiently.
The primary components involved are:
Background WriterCheckpointer
These processes write modified pages back to storage in batches, reducing random I/O and improving throughput.
Measuring Buffer Cache Effectiveness
PostgreSQL exposes statistics that help measure cache efficiency.
One useful query is:
SELECT
    sum(heap_blks_hit) AS hits,
    sum(heap_blks_read) AS reads
FROM pg_statio_user_tables;
A larger number of hits relative to reads generally indicates that queries are being served from memory instead of disk.
You can also inspect the configured buffer size:
SHOW shared_buffers;Many deployments start with approximately 25% of available RAM, though the ideal value depends heavily on workload characteristics.
Monitoring these metrics can reveal whether performance issues are caused by slow queries or excessive disk access.
Why This Matters for Performance
Every query ultimately depends on data access.
If the required page already exists in Shared Buffers, PostgreSQL can respond quickly. If it must fetch data from disk, latency increases significantly.
The effectiveness of Shared Buffers influences:
- Query response times
- Transaction throughput
- Disk I/O utilization
- Overall system scalability
Many performance problems that appear to be query issues are actually memory and caching issues underneath.
Understanding how PostgreSQL manages its buffer cache provides valuable insight into why some queries are consistently fast while others suddenly become slow.
Final Thoughts
Shared Buffers is one of PostgreSQL’s most important performance features. It acts as the database’s first line of defense against expensive disk access, allowing frequently used data to remain available in memory.
The Clock-Sweep algorithm ensures this cache remains efficient even under high concurrency by giving active pages additional chances to stay in memory while gradually removing cold pages.
Once you understand Shared Buffers, concepts like cache hit ratios, dirty pages, checkpoints, and query performance become much easier to reason about. And when you’re troubleshooting a slow database, that’s knowledge that pays dividends.