Reading PostgreSQL Query Plans: Finding the Gap Between Estimated and Actual Rows
Learn how to analyze PostgreSQL execution plans by comparing estimated and actual row counts to uncover cardinality estimation problems and performance bottlenecks.
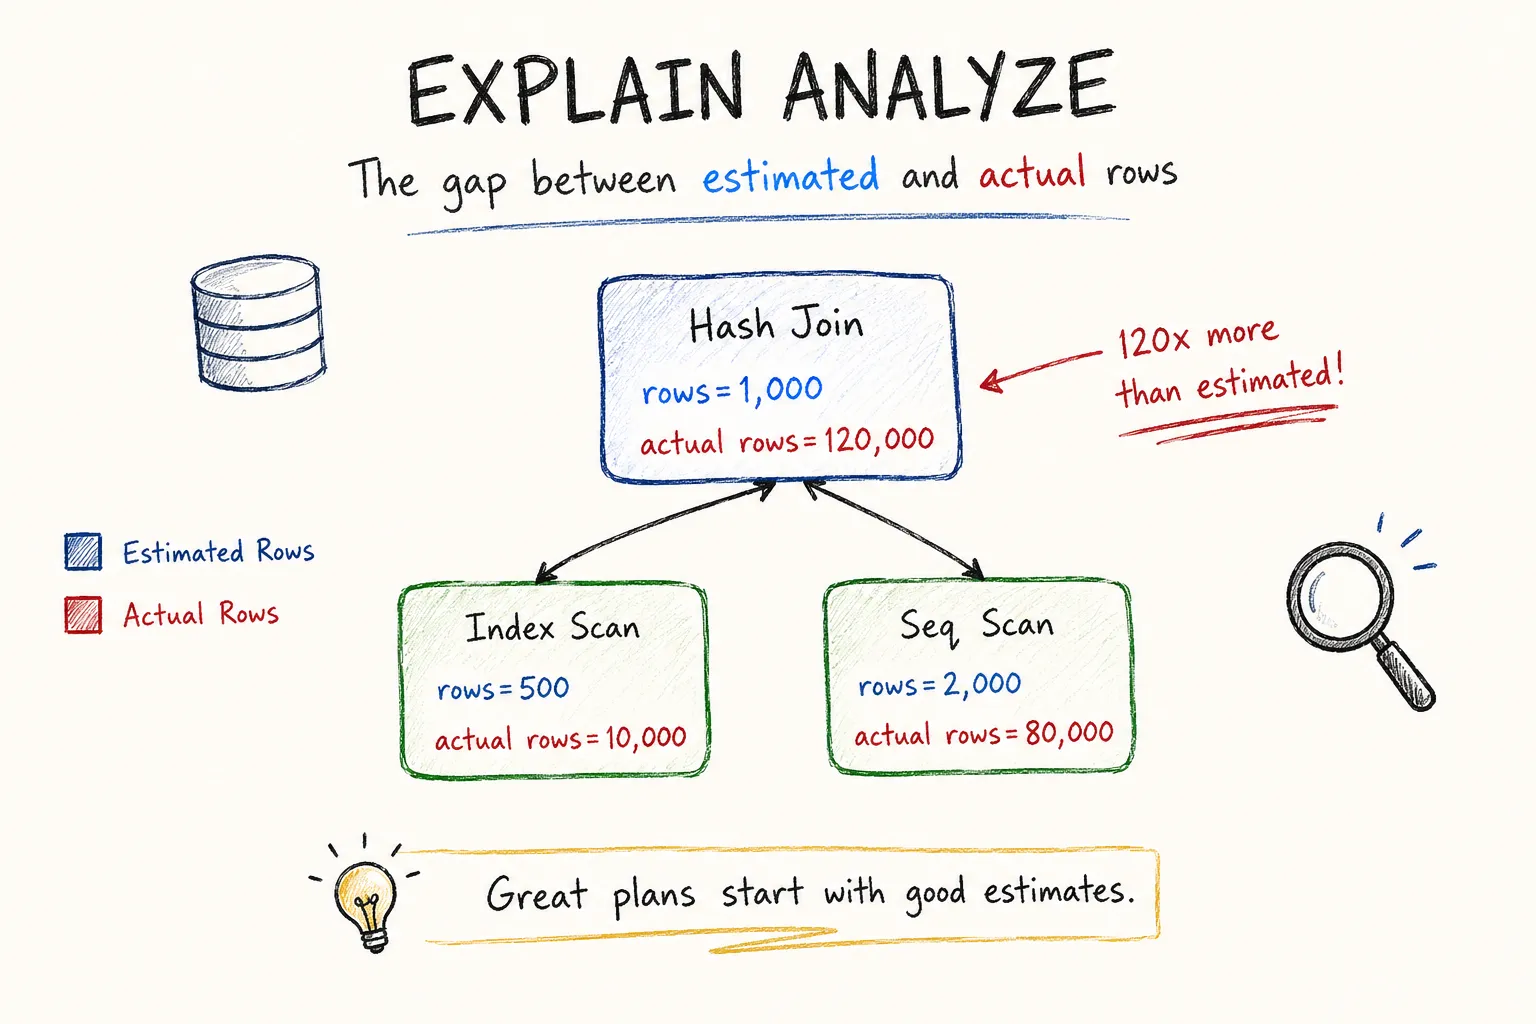
Most developers start reading query plans by learning what a Seq Scan, Index Scan, or Nested Loop means. I did the same. But after spending more time debugging slow queries, I realized that the biggest performance clues usually aren’t the node types themselves.
The real story is often hidden in the difference between estimated rows and actual rows.
Why Row Estimates Matter
PostgreSQL’s planner doesn’t know the future.
Before executing a query, it makes educated guesses about how many rows each operation will return. Those estimates are used to calculate costs and ultimately determine which execution strategy to choose.
If the estimates are accurate, the planner usually picks a good plan.
If the estimates are wrong, PostgreSQL can confidently choose a terrible plan.
Consider a simplified execution plan:
Index Scan using idx_orders_user_id on orders
(cost=0.43..120.00 rows=50 width=64)
(actual time=0.12..42.80 rows=25000 loops=1)
The planner expected around 50 rows.
The query actually returned 25,000.
That’s not a small miss. That’s a completely different reality.
Query plans are often less about which node was chosen and more about why PostgreSQL thought that choice was reasonable.
The Most Important Line in EXPLAIN ANALYZE
Whenever I read a plan, the first thing I compare is:
rows=EstimatedRows
actual rows=ActualRows
For example:
Hash Join
(cost=1000..5000 rows=1000)
(actual time=25..600 rows=120000)
The planner expected:
1,000 rowsReality:
120,000 rowsThat’s a 120x error.
At that point, I stop looking at node types and start asking:
- Why did PostgreSQL think only 1,000 rows existed?
- Which table statistics are inaccurate?
- Is data distribution skewed?
- Are predicates correlated?
- Are statistics outdated?
Those questions usually lead to the actual problem.
Understanding Cardinality Estimation
The process of predicting row counts is called cardinality estimation.
PostgreSQL relies heavily on collected statistics to make these predictions.
Some of the information it stores includes:
- Distinct value counts
- Null fractions
- Histograms
- Most common values
- Correlation statistics
When you run:
ANALYZE users;PostgreSQL samples table data and updates these statistics.
The planner then uses those statistics to estimate selectivity.
For example:
SELECT *
FROM users
WHERE country = 'India';
If statistics indicate that 10% of rows belong to India, PostgreSQL estimates:
Estimated Rows = Total Rows × 10%Simple queries often work well.
Complex predicates are where estimation starts getting difficult.
Spotting Estimation Problems
Small Differences Are Normal
Suppose we see:
Estimated: 10,000
Actual: 12,000
This is usually fine.
No estimation system is perfect.
The planner doesn’t need exact numbers.
It only needs estimates close enough to choose good execution strategies.
Large Differences Are Warning Signs
Now imagine:
Estimated: 100
Actual: 50,000
or
Estimated: 500,000
Actual: 2,000
These gaps should immediately grab your attention.
Large estimation errors often lead to:
- Wrong join algorithms
- Excessive memory allocation
- Hash table spills
- Unexpected sequential scans
- Poor index selection
In many production incidents I’ve investigated, the root cause wasn’t the execution engine.
It was the planner being fed incorrect assumptions.
How Bad Estimates Create Bad Plans
Let’s say PostgreSQL predicts only a few rows will be returned.
Because of that assumption, it chooses a Nested Loop.
Estimated Rows: 50
Join Type: Nested Loop
But reality looks like this:
Actual Rows: 100,000A nested loop that seemed cheap suddenly becomes extremely expensive because it now executes thousands of additional index lookups.
The planner wasn’t irrational.
It was operating with bad information.
That’s why simply saying “Nested Loops are slow” is usually incorrect.
The real issue is often:
Bad Estimates → Bad Cost Calculation → Bad Plan ChoiceA Practical Workflow for Reading Plans
When I analyze a query plan, I follow a simple process.
Step 1: Run EXPLAIN ANALYZE
EXPLAIN ANALYZE
SELECT ...
This gives both estimated and actual execution information.
Without actual values, you’re only looking at planner predictions.
Step 2: Scan for Row Count Mismatches
I immediately compare:
rows=
actual rows=
for every major node.
I’m looking for:
10x
50x
100x
1000x
differences.
Those usually deserve investigation.
Step 3: Trace the First Error
A common mistake is focusing on the slowest node.
Instead, I try to locate the first major estimation error.
Often a bad estimate near the top of the plan is simply a consequence of an earlier mistake lower in the tree.
Fixing the original estimation issue can improve the entire execution plan.
Step 4: Verify Statistics
When estimates look suspicious, I check:
ANALYZE table_name;and inspect table statistics.
In some cases, increasing statistics targets can improve estimation quality:
ALTER TABLE users
ALTER COLUMN country
SET STATISTICS 1000;
More detailed statistics can help PostgreSQL understand skewed data distributions.
When Estimates Fail Completely
Some scenarios are naturally difficult for planners.
Correlated Columns
Consider:
WHERE country = 'India'
AND city = 'Kolkata'
If PostgreSQL assumes those filters are independent, it may severely underestimate or overestimate the result set.
In reality, those columns are highly related.
Skewed Data
Suppose:
95% Active
5% Inactive
A generic estimate may not accurately represent the distribution.
The planner can end up making poor assumptions for uncommon values.
Rapidly Changing Tables
Large write-heavy tables can outgrow their statistics quickly.
If statistics become stale, estimates drift further away from reality.
The planner then starts making decisions based on an outdated snapshot of the data.
What I Look For First Today
Earlier in my career, I spent most of my time identifying execution nodes.
I would look at a plan and say:
- This is a
Hash Join - This is a
Bitmap Index Scan - This is a
Nested Loop
That helped me understand the mechanics.
But now the first thing I look for is whether PostgreSQL’s assumptions match reality.
A query plan is essentially a conversation between the planner and the database.
The estimated rows show what PostgreSQL expected.
The actual rows show what actually happened.
The most interesting performance problems live in the gap between those two numbers.